📁 System Monitoring
Majority of our core services are deployed on AWS and forward logs to Grafana via Loki. We can get useful alerts straight from the AWS metrics and Grafana logs. Whenever there is something wrong, someone responsible should be notified. This document explains how these alerts are set-up and how to work with them.
As a note, logs alerts are related to the activities of the monitoring team, but they are not a subset nor superset. Take for example Airseeker. Making sure the dAPIs are not falling behind is done by monitoring team by comparing the on-chain/off-chain price and raising an alert in case the price differs unexpectedly. In these cases, there may not necessarily be an error log in Grafana. On the other hand, there can be an RPC issue with gas price causing us to overpay for each data feed update, which only a very detailed monitoring would notice. For this, there would most likely be an error/warning in the logs.
High level decisions
- For AWS metrics, we use SNS topic that sends an email to the responsible person.
- Grafana alerts from logs are sent to Slack.
- There is a separate channel for each service:
- #airseeker-v2-alerts
- #airnode-feed-alerts
- #signed-api-alerts
- #oev-auctioneer-alerts
- Only warnings and errors are alertable.
- Every alert must be inspected and it must be clear who is responsible for particular service alerts.
AWS Metrics & Alerts
To setup AWS alarms, one needs to create a SNS topic that triggers the notification and the alarms which publish the alerts to the SNS topic. Both of these should be managed by the service infra. Because all of our AWS services are deployed using CloudFormation, these should be defined there.
Grafana alerts
Grafana alerts are set up in the Grafana UI. To create an alert, follow these guidelines:
- Follow the existing format of Slack notifications, alarm names, locations, etc...
- Create specific alerts for repetitive warnings/errors and a single general alerts for all other.
- Send the alert to specific Slack channel and include labels that help to identify the alert, right in the Slack channel.
- Whenever creating something new, it's best to duplicate an existing alert and modify it accordingly.
- Here is a quick tip how to work with Grafana alerts.
This is how Grafana alerts with Slack notifications are setup:
- There is a notification template inside
Notification Templatestab here. This defines the slack notification format for each service. Note, that the templating is pretty hard to work with, so it is recommended to copy the existing template and modify it and in general - less is more. - In
Contact Pointsthere is a contact that forwards the alerts to each service's Slack channel. This is done by registering a web hook for the specific Slack channel. - There are multiple
Alert ruleshere. One for each service. All alerts for a single service should use the same contact point.
Adding alerts for a new service
- Create a slack channel
#<SERVICE_NAME>-alerts(e.g. #oev-auctioneer-alerts) and add incoming web hook to it. Click channel title to go to the channel settings, thenIntegrationstab, thenAdd an appand search forIncoming Webhook. You should see the following:
- Click
View->Configurationwhich will open the configuration page in browser. ClickAdd to Slackand choose the channel to post. - Save the
Webhook URLfor the next step in which we add integrate it with Grafana. - Edit the notification template to include the new service. See
 Double check if the labels in the template are right and modify them accordingly.
 - Add a new contact point. See
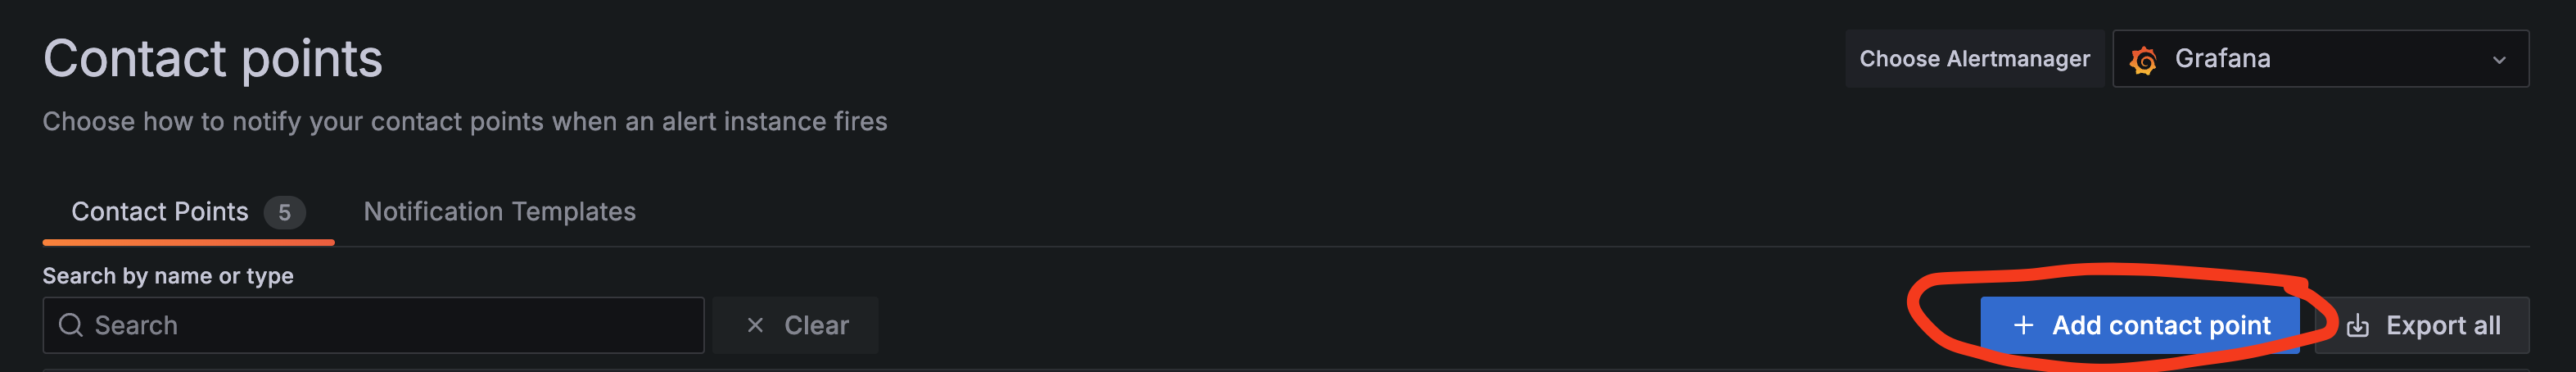 Be sure to select
 Slackas integration and write theWebhook URLof the target Slack channel. In theOptional Slack settingschange theTitleandText bodyto use the editted notification template. - Proceed to
Alert ruleshere and duplicate one of the existing rules forUnexpected log formatby clickingMore->Duplicate. See:
- Change the rule name and alert condition, specifically the group by rule. In
3. Set evaluation behaviorcreate a new folder and a new evaluation group. - In
4. Configure labels and notificationschange the contact point and save the rule.
Create a new alert
- Duplicate existing alert from the same alert group.
- Change the alert name and alert condition.
- Click
Save rule and exit. The new rule should appear shortly. - Don't forget to update the rule for other warnings/errors in case you have created an alert for a specific error.
Remove an alert
- Remove a specific alert.
- Don't forget to update the rule for other warnings/errors in case you have created an alert for a specific error.
add-contact-point.png
add-contact-point.png
create-unexpected-log-format-alert.png
create-unexpected-log-format-alert.png